Regression to the Mean
Unlike momentum or the hot hand, regression to the mean is an actual phenomenon. (OK, maybe there is something to the hot hand)
Most measurements of human ability are partly achieved by skill and partly achieved by luck. This means that data cannot always be taken at face value. (fangraphs.com)
Regression the to mean explains why a 48-percent-shooting team likely won’t duplicate its 65 percent first half performance after halftime, despite no meaningful changes from one half to the next. Whether it’s field goal percentage or the number of heads when flipping a coin, more variablilty is possible in smaller sample sizes. Over the long run things generally settle to their expected values.
That leads us to the first weekend of the NCAA tournament. It’s tempting to see a team dominate its first two games and assume that domination will continue. However, we should not be surprised when this does not happen.
People sometimes misinterpret regression to the mean when they believe a shooter in a slump is “due” to play better. Regression to the mean isn’t a law that dictates what will happen, but is rather an simple explanation for a natural phenomenon.

(Source: xkcd)
Enough theory. What does this actually mean for the Sweet 16?
Here are the top five teams from the first weekend of the tournment ranked by their net efficiency margin (NEM).
| Team | NEM per game |
|---|---|
| Duke | 44.6 |
| Arizona | 37.0 |
| Michigan St. | 36.0 |
| Xavier | 32.3 |
| Utah | 29.6 |
Based on that alone, you might conclude that Duke and Arizona are destined to meet on a Monday night in Indianapolis. The point is not that we can say either is due to fall back to its typical level this weekend. Instead, we can use our knowledge of this natural phenomenon to watch out for teams that might be overvalued or undervalued based on the first weekend. (While I didn’t specifically say so earlier, regression to the mean works in either direction.)
Here are the five teams that outplayed their pre-tourney NEM average during the first weekend.
| pre-tourney | tourney | |
|---|---|---|
| Team | NEM | NEM |
| Michigan St. | 21.3 | 36.0 |
| Xavier | 18.7 | 32.3 |
| Duke | 31.8 | 44.6 |
| UCLA | 13.4 | 21.2 |
| West Virginia | 19.1 | 26.5 |
Is it possible that Duke is onto something after dismissing Rasheed Sulaimon, or that Tom Izzo has a formula for March more secret than the Coca-Cola formula? Sure, it’s possible, but the simpler and more likely explanation is a variation due to randomness (or chance or luck, if you prefer) over a small sample. Again, that doesn’t mean that any of these teams are due to return to Earth in their next game. It simply means that the more games they play, the more likely that their performance will reflect their true level. In this case, we measure that by the NEM over the entire season.
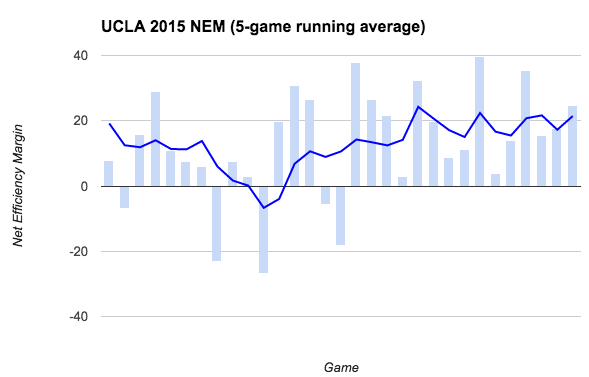
UCLA is an interesting case. Many (including the CTD selection model) did not find their profile at-large worthy, but the only opinion that counts put them in the field. Although the Bruins had the worst pre-tourney NEM (13.4) of the remaining teams, a quick look at their season trend (the dark blue line) shows they have been playing better over the last two months or so. It may still not be enough to beat Gonzaga, but their first two games aren’t as out of character as they would first appear.
Which teams are candidates for a positive regression to the mean? These teams won their first two games despite playing below their true ability, at least according to NEM.
| pre-tourney | tourney | |
|---|---|---|
| Team | NEM | NEM |
| Kentucky | 40.5 | 27.7 |
| Wisconsin | 33.8 | 22.5 |
| Notre Dame | 24.9 | 15.6 |
| Oklahoma | 24.4 | 19.5 |
| North Carolina | 24.7 | 20.0 |
The difficulty in recognizing the role of randomness in our everyday lives is human nature. I highly recommend Leonard Mlodinow’s The Drunkard’s Walk if you’d like to learn more.